%sql
create or replace table tmp_geometries as
select
  "Onze Lieve Vrouwetoren" as name,
  st_transform(st_point(155000, 463000, 28992), 4326) as geometry
union all
select
  "Bermuda Triangle" as name,
  st_makepolygon(
    st_makeline(
      array(
        st_point(- 80.1935973, 25.7741566, 4326),
        st_point(- 64.7563086, 32.3040273, 4326),
        st_point(- 66.1166669, 18.4653003, 4326),
        st_point(- 80.1935973, 25.7741566, 4326)
      )
    )
  ) as geometry;

from
  tmp_geometries
-- Returns:
-- name geometry
-- Bermuda Triangle SRID=4326;POLYGON((-80.1935973 25.7741566,-64.7563086 32.3040273,-66.1166669 18.4653003,-80.1935973 25.7741566))
-- Onze Lieve Vrouwetoren SRID=4326;POINT(5.3872035084137675 52.15517230119224)Native Point Map Visualization
Point map visualization is natively supported, if your table outputs longitude-latitude pairs. It is recommended to limit the query to not too many rows for performance reasons.
Note
Make sure you are using Serverless environment version 4+, or else outputting GEOMETRY/GEOGRAPHY types directly (without e.g. st_asewkt()) will not work.
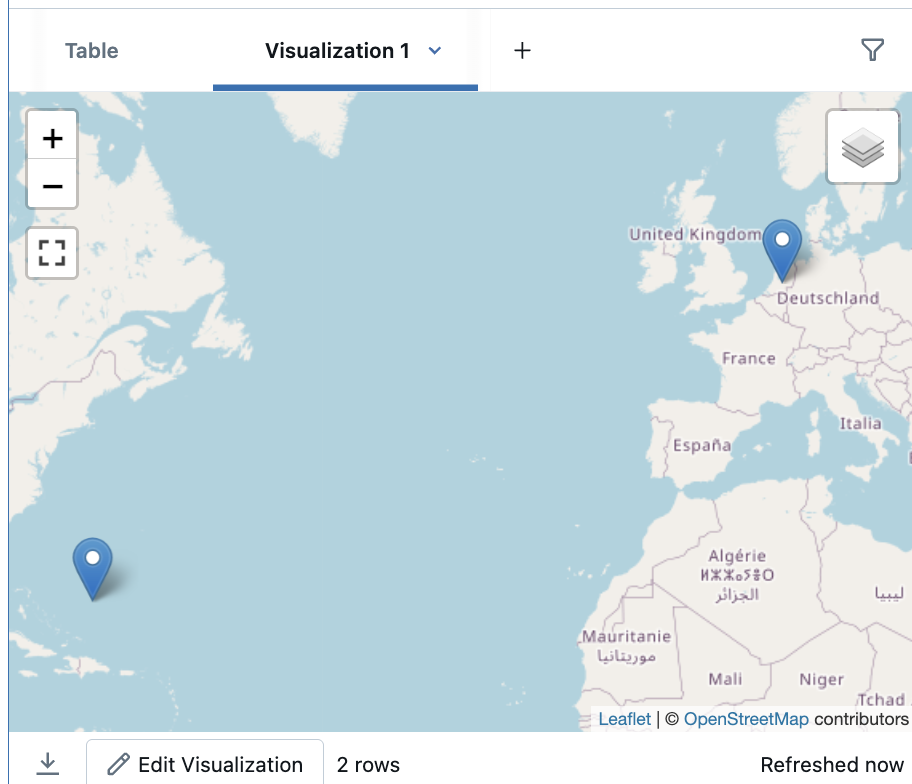
Our example table contains not only points, but the native visualization can only show points, so one thing we can do is to show the centroids.
In the above example, the SRID happens to be 4326, therefore the below st_transform is a unnecessary. In general, however, you’d want to transform the geometries to 4326 in order to obtain valid (lon, lat) tuples.
Once the result above is shown, click on the + icon right of the Table tab to add the visualization “Map (Markers)” such as the one shown on the below image.
For another, larger example of native map visualization, see the Overture example used in the DuckDB notebook.